Note: In moving to Quarto blogs, I lost the original post related to ggtext but I’ve kept the visuals as this project helped me learn a lot about regular expressions.

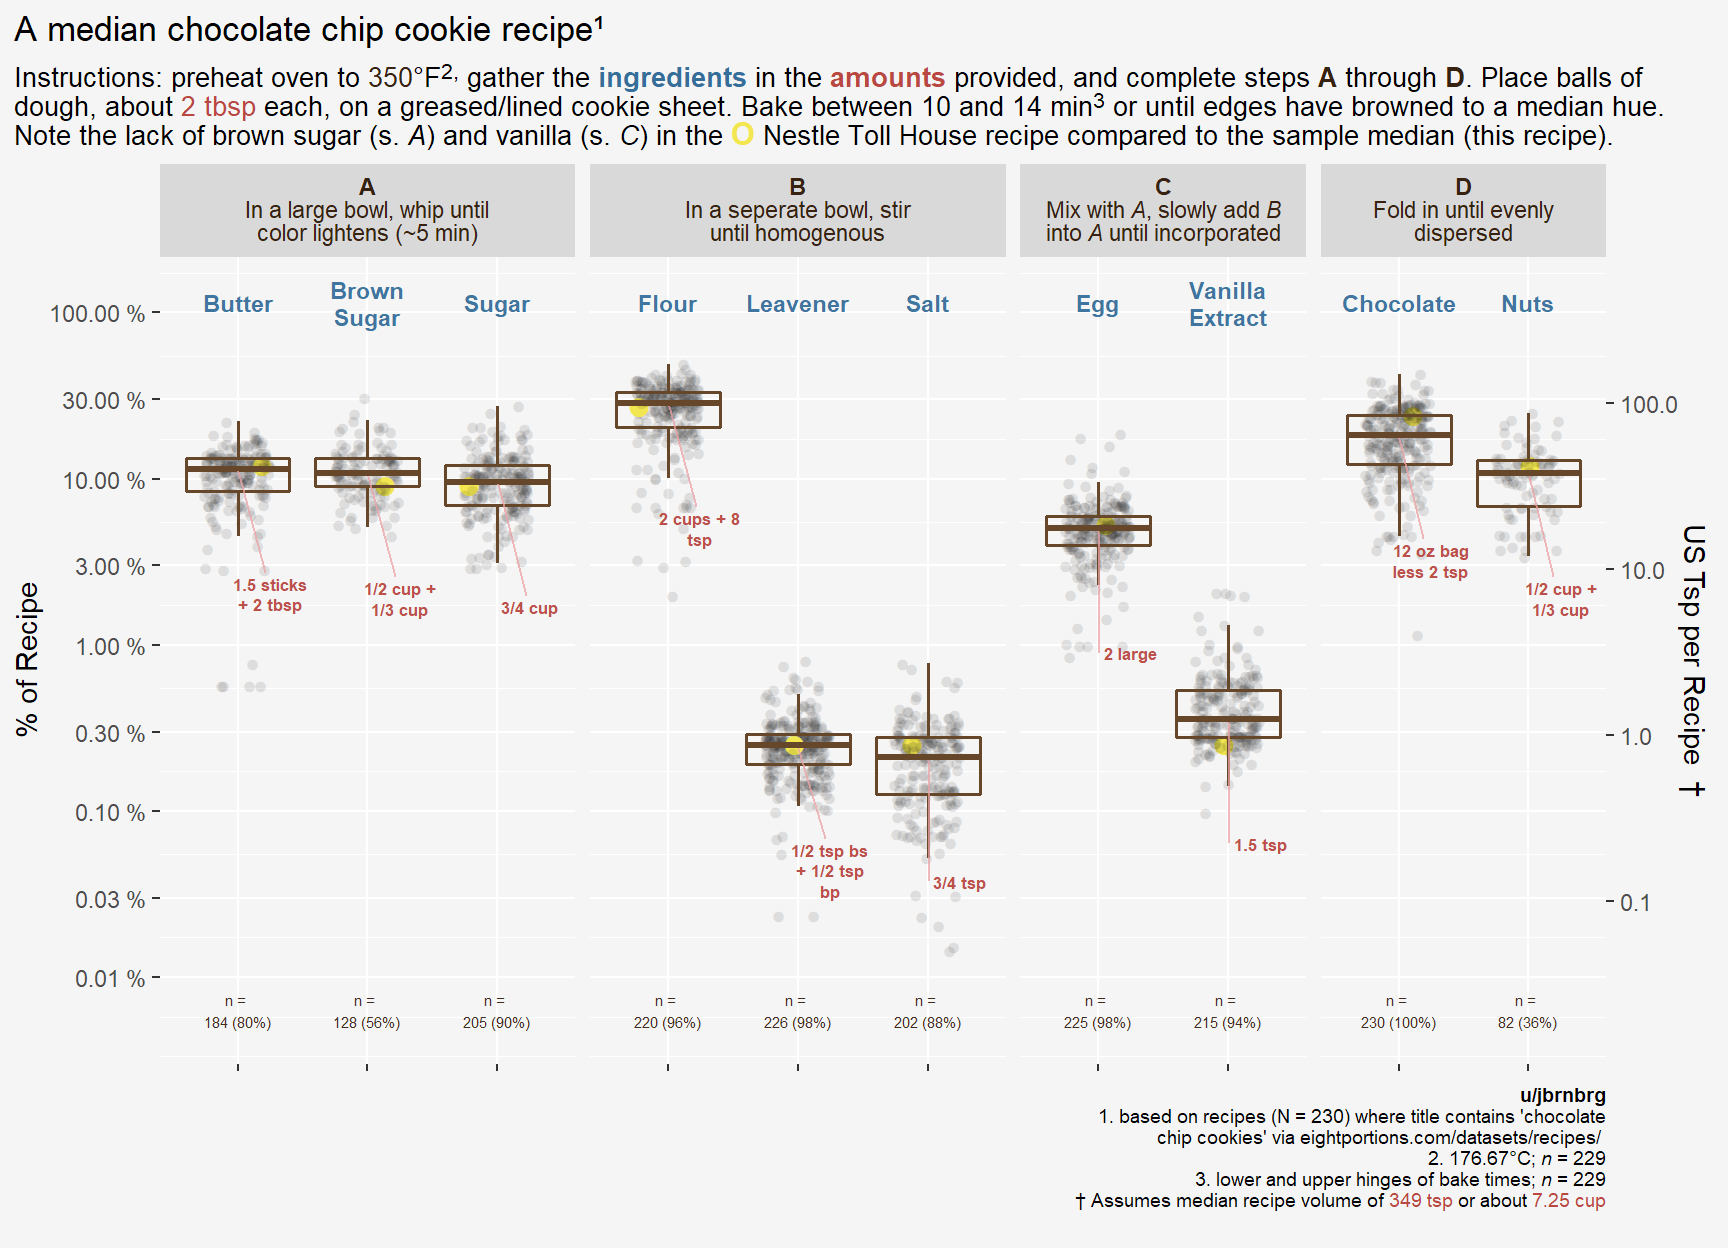
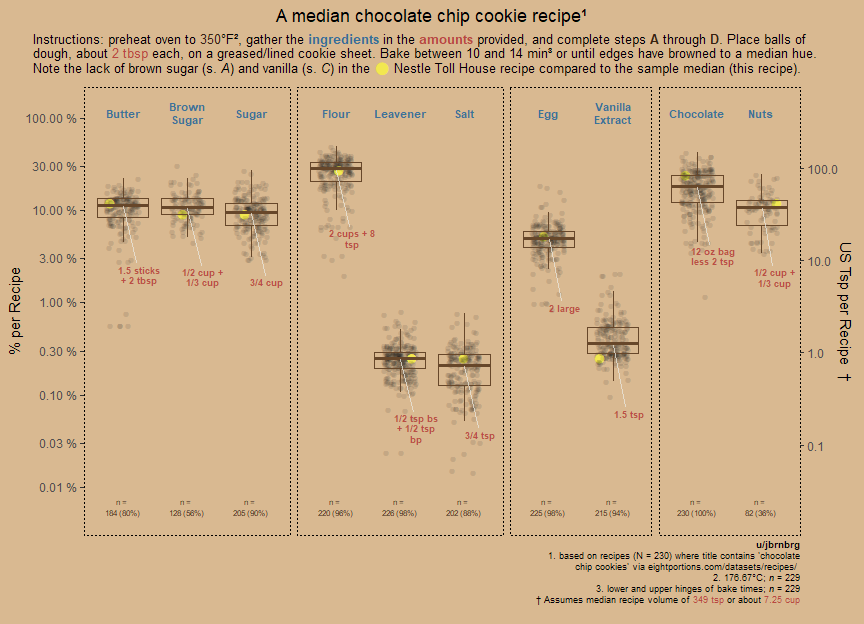
Another version of the plot that I shared on reddit’s dataisbeautiful.

Based on 200+ recipes. Nestle Toll House recipe included as reference. Preliminary test results (N = 1) yielded responses such as: “Not half bad.”
The data source used: eightportions.com’s “Recipe Box” data containing title text "chocolate chip cookies" - see eightportions’ page for additional details.
Tools used: regex/clean/wrangle & viz completed in R (tidyverse & ggplot/ggtext respectively).
Procedure: Measurements were converted to US teaspoons to obtain the percentage of a given ingredient in a recipe. Ingredients were aggregated and sorted descending by in-recipe frequency. Items were included if the cumulative sum of the median percentages was less than or equal to 100%. Nuts made it with an in-recipe frequency of 36%. I used walnuts but you can swap out the nuts for whatever you want or leave them out.
| Ingredients | Approx. Amts | Obs. Med % | Obs. Tsp | Scaled Med %* | Scaled Med Tsp | In-Recip. Freq. |
|---|---|---|---|---|---|---|
| Chocolate | 12 oz bag less 2 tsp | 18.2% | 66.96 | 19.2% | 70.00 | n = 230 (100%) |
| Leavener | 1/2 tsp bs + 1/2 tsp bp | 0.2% | 0.91 | 0.3% | 1.00 | n = 226 (98%) |
| Egg | 2 large | 5.0% | 18.48 | 5.3% | 18.00 | n = 225 (98%) |
| Flour | 2 cups + 8 tsp | 28.3% | 104.17 | 29.8% | 104.00 | n = 220 (96%) |
| Vanilla Extract | 1.5 tsp | 0.4% | 1.32 | 0.4% | 1.50 | n = 215 (94%) |
| Sugar | 3/4 cup | 9.6% | 35.17 | 10.1% | 36.00 | n = 205 (90%) |
| Salt | 3/4 tsp | 0.2% | 0.78 | 0.2% | 0.75 | n = 202 (88%) |
| Butter | 1.5 sticks + 2 tbsp | 11.4% | 42.04 | 12.0% | 42.00 | n = 184 (80%) |
| Brown Sugar | 1/2 cup + 1/3 cup | 10.8% | 39.59 | 11.3% | 40.00 | n = 128 (56%) |
| Nuts | 1/2 cup + 1/3 cup | 10.8% | 39.58 | 11.3% | 40.00 | n = 82 (36%) |
- Scaled to sum to 100%