Failure-to-Deliver Data via SEC and the GameStop Stock
The SEC’s fails-to-deliver data, per the SEC website, represents the “aggregate net balance of [equity] shares that failed to be delivered as of a particular settlement date.” Further, the SEC website clarifies what these values represent:
The figure is not a daily amount of fails, but a combined figure that includes both new fails on the reporting day as well as existing fails. In other words, these numbers reflect aggregate fails as of a specific point in time, and may have little or no relationship to yesterday’s aggregate fails.
With respect to the “retail-investor revolution” surrounding GameStop’s stock ($GME) and the “short squeeze” theory/claims, today’s short post is going to explore the Security Exchange Comission’s (SEC) failure-to-deliver data (FTD) to see whether GME’s FTDs were exceptionally high in the past year or so of data.
To see how this data is related to the GME story, please check out the reference section at the end of this post that contains several links to additional sources.
That said, let’s get started!
FTD Data
So: were the number of fail-to-deliver (FTD) shares related to GME exceptional among other organizations in the past year or so of data?
To answer this question, I pulled down 25 .zip files from the SEC’s FTD portal for Jan 2020 through the first half of Jan 2021 (updated 2021-03-11 with additional data).
library(tidyverse)
library(vroom)
library(tools)
library(lubridate)
library(glue)
this_path <- "C:\\Path\\To\\Dir\\With\\My\\secfails"
Next, I read in the 25 files with vroom, combined them, and performed some minor cleanup including converting the SETTLEMENT DATE to date format.
file_list <- list.files(this_path, full.names = T)

df <- tibble()

for (i in (1:length(file_list)) ) {
  df <- vroom::vroom(file_list[i]) %>%
    mutate(file_name =  file_path_sans_ext(basename(file_list[i])),
           PRICE = as.numeric(PRICE),
           `SETTLEMENT DATE` = as.Date(as.character(`SETTLEMENT DATE`),
                                       format="%Y%m%d")) %>%
    rbind(df)
}

df <- df %>%
  rename(fails = `QUANTITY (FAILS)`) %>%
  filter(!is.na(fails), fails > 0) %>%
  group_by(SYMBOL, `SETTLEMENT DATE`) %>%
  summarise(fails = max(fails),
            .groups = "drop") %>%
  mutate(tag = ifelse(SYMBOL == "GME", "GME", "All Others"))
Here’s is a preview of the data:
glimpse(df, width = 72)## Rows: 1,310,912
## Columns: 4
## $ SYMBOL <chr> "1208PS", "1208PS", "1208PS", "1208PS", "120~
## $ `SETTLEMENT DATE` <date> 2020-06-01, 2020-06-02, 2020-06-03, 2020-06~
## $ fails <dbl> 51028, 51028, 51028, 51028, 51028, 36, 36, 3~
## $ tag <chr> "All Others", "All Others", "All Others", "A~Of the over 1.2M rows of data between Jan’20 and Jan’21, the symbol GME appears on 259 of the 270 days in the data. With that many observations and 16,866 unique SYMBOLs in the data, I will use a density plot to compare the distributions of FTDs between GME and All Others:
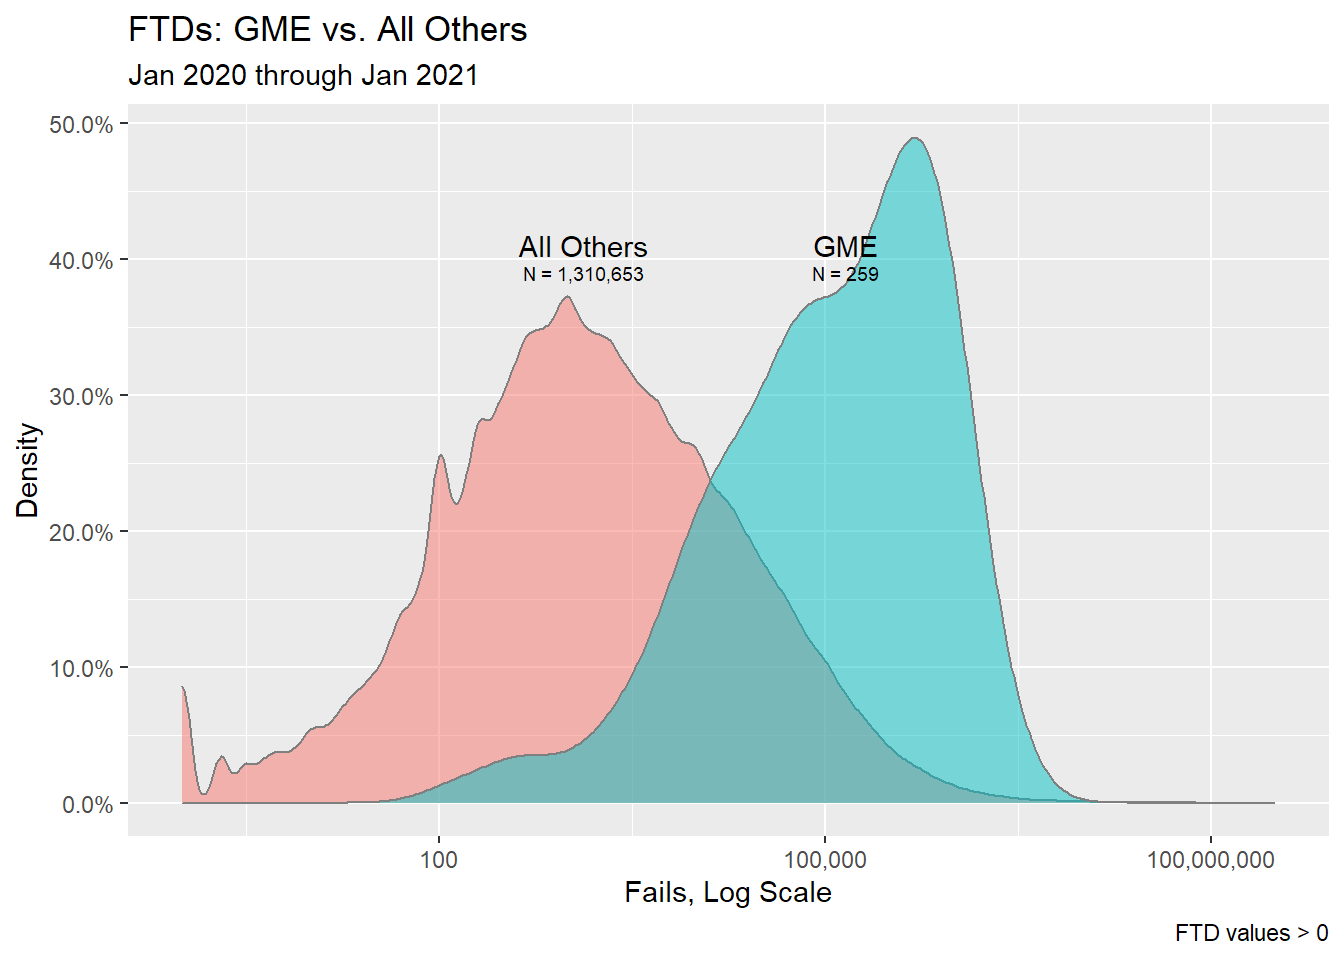
Given the above and based on the scope of the data plotted, I feel confident saying that GME’s FTD values are, in general, higher than other FTD values in the FTD files.
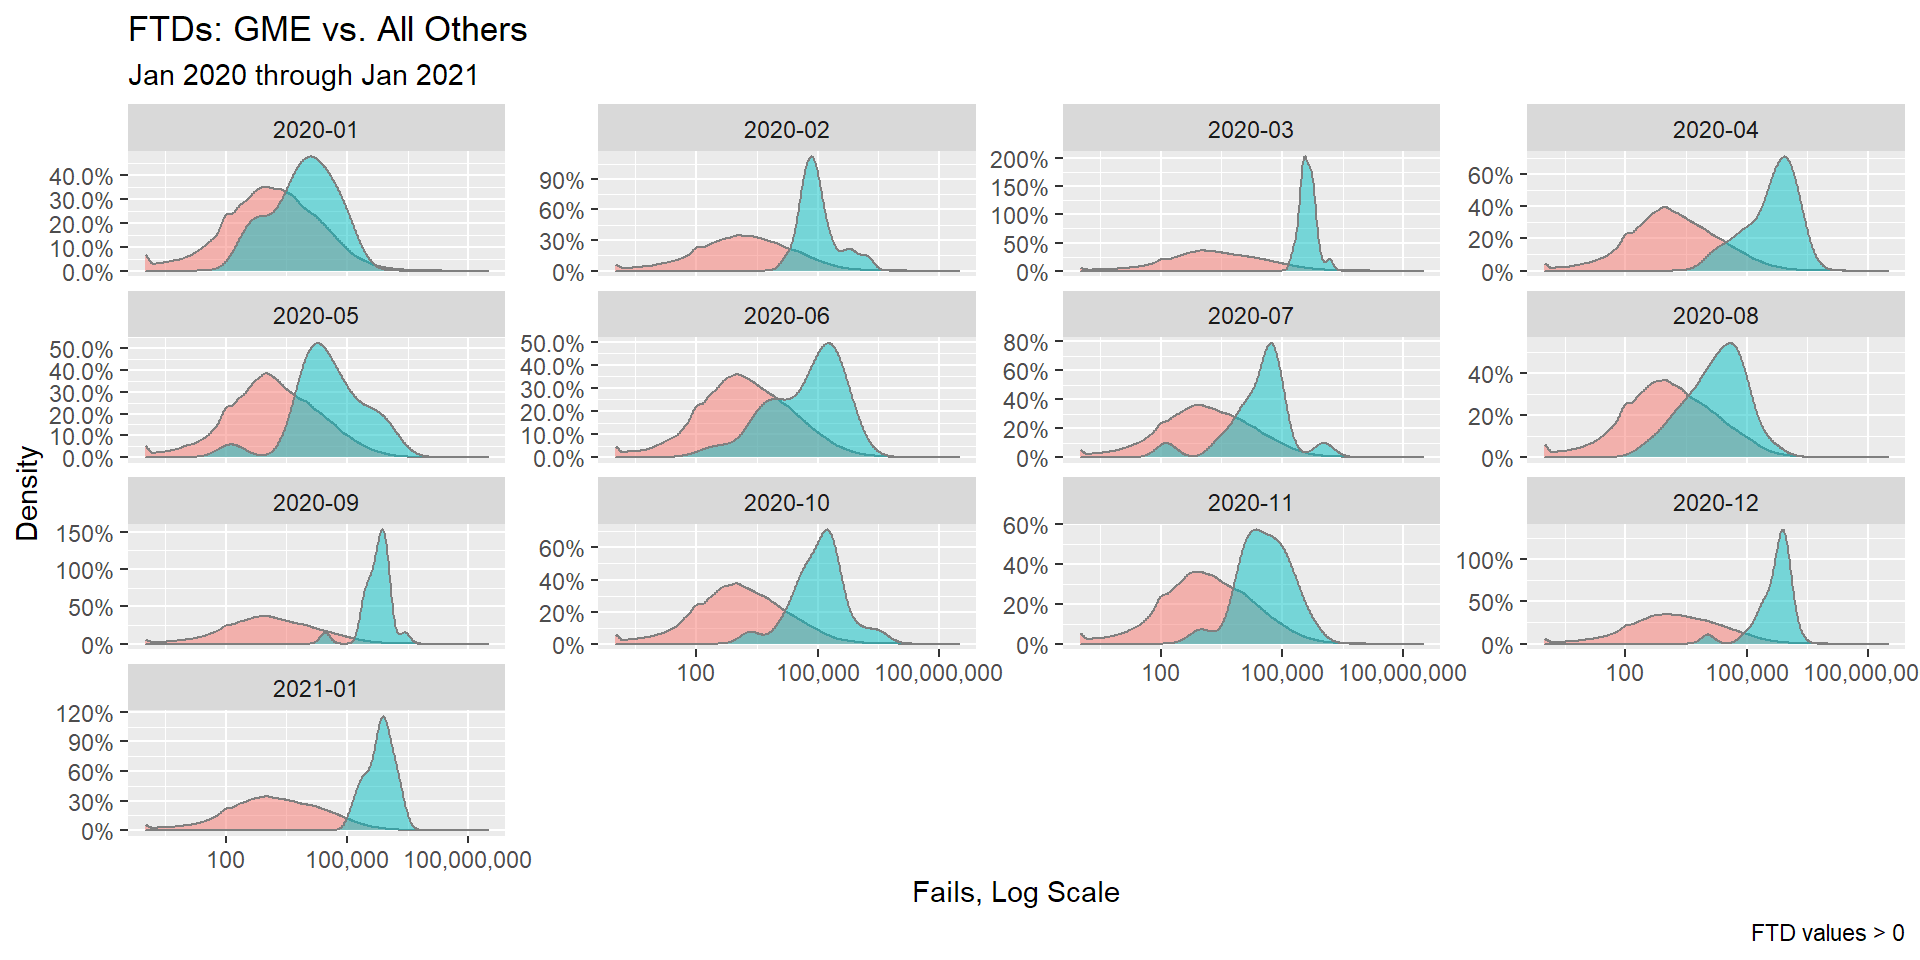
When reviewing this data on a monthly basis, it appears that a similar pattern emerges except, possibly, on Jan’20 and Aug’20, where it’s less clear:
 Although this is interesting data, it is a mere single component in an evolving story that’s already had many twists and turns.
I may revisit this story in later posts but for now, that is all. Stay safe out there!
References
- Bloomberg: How WallStreetBets Pushed GameStop Shares to the Moon
- Investopedia: Failure To Deliver
- NBC News: SEC vows to protect ‘retail investors,’ amid GameStop frenzy
- Westlaw: Robinhood cites SEC bulletin as defense in trader lawsuit
- Fails-to-Deliver Data, SEC.gov
- Investopedia Commentary: The Truth About Naked Short Selling
- TheStreet.com: Naked Shorting is Illegal: So How the Hekk was GameStop 140% Short?
- $GME on Yahoo! Finance
- Online trading app RobinHood hit with class-action lawsuit over decision to halt GameStop stock sales