An Interactive Dash App for NYC Gas Consumption and Cost
I had some time this past weekend so I created a Dash App to deploy on Heroku as part of this website portfolio. I’ve created visualizations in plotly using both R and Python but I wanted to show off my Dash skills with a relatively simple application that I could walk through in a short amount of time. Here’s a screen-cap preview:
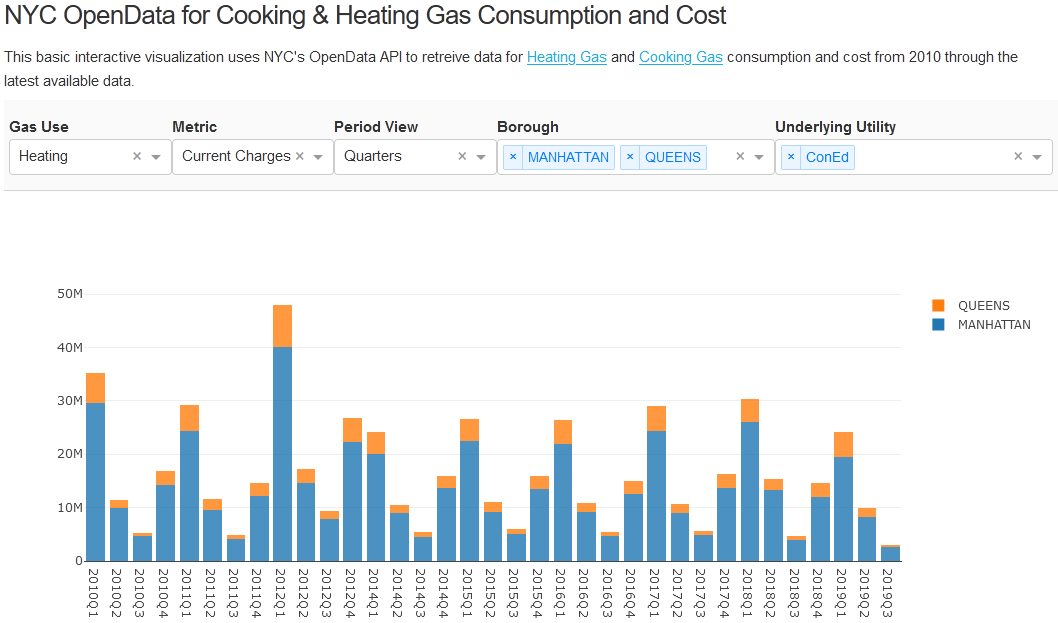
Screen capture of Gas App hosted on Heroku
Dash is a plotly product for building “beautiful web-based interfaces in Python.” While it requires a bit more legwork than shiny with flexdashboard, it does offer a lot of control over presentation and provides access to python’s massive package selection.
Tl;dr: Link to Dash App on Heroku
Update 2020-05-13: An update to the underlying data required a very minor code update to the API query.
Below, I present the code for the app. All chunks form a single app.py file.
Data
First I obtain the data via the NYC OpenData API. Below, I query two different datasets (one for cooking gas and one for heating gas) and combine them:
import pandas as pd
import dash
from dash.dependencies import Input, Output
import dash_core_components as dcc
import dash_html_components as html
import plotly.graph_objs as go

external_stylesheets = ['https://codepen.io/chriddyp/pen/bWLwgP.css']

app = dash.Dash(__name__, external_stylesheets=external_stylesheets)
server = app.server

def gas_data():
    """ Queries data from the NYC OpenData APIs for Cooking and Heating Gas and
    returns a data frame with a 'source' column indicating cooking or gas.
    All values are grouped via 'q_grp' and 'revYM' """

    base_url = "https://data.cityofnewyork.us/resource/"
    gas = [list(a) for a in zip(['avhb-5jhc.json?','it56-eyq4.json?'],
                                ['Cooking', 'Heating'])]
    app_t = "$$app_token=MY_APP_TOKEN"  # https://opendata.cityofnewyork.us/

    q_grp = "borough,underlying_utility,funding_source,"

    q_val = "revenue_month as revYM," + \ # updated 2020-05-13
            "sum(current_charges) as revmCC," + \
            "sum(consumption_therms) as revmTherms"

    lim_url = "&$limit=50000&$offset=0"

    q_results = []

    for g in gas:
        q_url = (base_url + g[0] + app_t +
                 '&$select=' + q_grp + q_val + \
                 '&$group=' + q_grp  + "revYM" + \
                 lim_url
                 ).replace(' ', '%20')
        q = pd.read_json(q_url)

        # add Source column (cooking/Heating)
        q = q.assign(source = g[1])

        # normalize text in funding_source
        q.funding_source = q.funding_source.str.upper()

        q_results.append(q)

    result = pd.concat(q_results)

    # Add date columns for grouping
    result.revYM = pd.to_datetime(result.revYM)
    result.sort_values(by = "revYM", inplace = True)
    result['revY'] = result.revYM.dt.year
    result['revQ'] = result.revY.astype('str')+"Q" + \
                      result.revYM.dt.quarter.astype('str')

    return(result)

def get_cc(df, prd = 'revQ'):
    """ pivots the df from 'gas_data()' according to user-selections """
    x = pd.pivot_table(df,
                       values = ['revmCC','revmTherms'],
                       index = [prd],
                       columns = ['borough'],
                       aggfunc = 'sum')
    x.columns = ['_'.join(col).strip() for col in x.columns.values]
    x.reset_index(inplace = True)

    return(x)

df = gas_data()
Layout
Next I build up the app’s layout using Dash’s html component library:
markdown_text = '''
#### NYC OpenData for Cooking & Heating Gas Consumption and Cost

This basic interactive visualization uses NYC's OpenData API to
retreive data for Heating Gas and Cooking Gas consumption and
cost from 2010 through the latest available data.
'''

sources_sel = df.source.unique()
undutil_sel = df.underlying_utility.unique()
fundsrc_sel = df.funding_source.unique()
borough_sel = ['QUEENS', 'BROOKLYN', 'BRONX', 'MANHATTAN', 'STATEN ISLAND']

app.layout = html.Div([
        # Text Description
        html.Div([
            dcc.Markdown(children = markdown_text)
        ]),

        # User Selection Dropdowns
        html.Div([

            html.Div([
                html.B('Gas Use'),
                dcc.Dropdown(id = 'source-selector',
                    options = [{'label': i, 'value':i} for i in sources_sel],
                    value = 'Heating',
            )], style = {'display':'inline-block',
                         'width':'15.5%'}),

            html.Div([
                html.B('Metric'),
                dcc.Dropdown(id = 'metric-selector',
                    options = [
                            {'label':'Thermal Consumption','value':'revmTherms'},
                            {'label':'Current Charges','value':'revmCC'}],
                    value = 'revmCC'
            )], style = {'display':'inline-block',
                         'width':'15.5%'}),

            html.Div([
                html.B('Period View'),
                dcc.Dropdown(id = 'period-selector',
                    options = [
                            {'label': 'Months', 'value': 'revYM'},
                            {'label': 'Quarters', 'value': 'revQ'},
                            {'label': 'Years', 'value': 'revY'}],
                    value = 'revYM'
            )], style = {'display':'inline-block',
                         'width':'15.5%'}),

            html.Div([
                html.B('Borough'),
                dcc.Dropdown(id = 'borough-selector',
                    options = [{'label': i, 'value':i} for i in borough_sel],
                    multi = True,
                    value = ['MANHATTAN', 'QUEENS', 'BRONX']
            )], style = {'display':'inline-block',
                         'width':'26.5%'}),

            html.Div([
                html.B('Underlying Utility'),
                dcc.Dropdown(id = 'undutil-selector',
                    options = [{'label': i, 'value':i} for i in undutil_sel],
                    multi = True,
                    value = ['ConEd','NatGrid NYC']
            )], style = {'display':'inline-block',
                         'width':'26.5%'})

        ], style = {'display':'inline-block',
                    'width':'100%',
                    'borderBottom':'thin lightgrey solid',
                    'backgroundColor':'rgb(250, 250, 250)',
                    'padding': '15px 5px'
                    }),

        # Plot Display
        html.Div([
            html.Div([
                dcc.Graph(id = 'cost-graph')

            ], style = {'width':'100%',
                        'display':'inline-block'})
        ])
])
Plot
Finally, I create the plot with the callback functions to populate the layout:
@app.callback(
    dash.dependencies.Output('cost-graph', 'figure'),
    [dash.dependencies.Input('borough-selector', 'value'),
     dash.dependencies.Input('source-selector', 'value'),
     dash.dependencies.Input('undutil-selector', 'value'),
     dash.dependencies.Input('metric-selector', 'value'),
     dash.dependencies.Input('period-selector', 'value')])
def my_barplot(b, s, u, m, p):
    """returns list of traces for barplots using user-selections u_sel"""
    dff = df[df.borough.isin(b) &
             (df.source == s) &
             df.underlying_utility.isin(u)]

    dfp = get_cc(dff, prd = p)

    traces = []

    for i in dff.borough.unique():

        traces.append(go.Bar(
            x = dfp.iloc[:,0],
            y = dfp[m + "_" + i],
            name = i,
            marker = dict(
                    opacity = 0.8)
        ))

    return {
        'data':traces,
        'layout': go.Layout(barmode='stack')
            }

if __name__ == '__main__':
    app.run_server(debug=True)
Deploying the app to heroku’s hosting service is pretty simple but you will need a github account and a heroku account. I recommend using Dash’s instructions for deployment here.
Updating Your App
As an update, here’s how you update your app. Download the Heroku CLI, start it and after logging in, you can pull down the existing repo using the following command:
heroku git:clone -a jb-gas-appRemember to replace jb-gas-app with the name of your app. Open up the .py file and make any necessary edits. When you’re happy it’s working as intended, run the following commands within the Heroku CLI:
heroku git:remote -a jb-gas-appThis should return a message:
set git remote heroku to https://git.heroku.com/jb-gas-app.gitThen commit the updated files with the following command (be sure to replace jb-gas-app where appropriate and make sure your commit message applies to your app):
git commit -am "updates bc it broke and new links"It’ll take a moment to run through some processees but eventually you’ll get a message like:
[master b2c08d3] updates bc it broke and new links
 1 file changed, 4 insertions(+), 4 deletions(-)
.
.
. %>%
remote: Verifying deploy... done.
To https://git.heroku.com/jb-gas-app.git
   ad9ef8b..b2c08d3  master -> master
Open up a browser, navigate to your app and you should see the changes reflected!